Introduction
ANAQUANT has developed an innovative standard dedicated to MS-based Host Cell Protein profiling analysis: the HCP-PROFILER. This solution is composed by both (1) a hydro-soluble bead coated with 54 peptides, based on the READYBEADS technology, which, after being spiked directly into the sample, releases peptides at well controlled amount to obtain directly a calibration curve; and (2) a software dedicated to this application to convert MS signals into amount of each identified protein. The HCP-PROFILER standard was developed according to the top 3 principle (Silva et al., 2006) to have a global strategy implementable to any biologic sample. TOP3 principle make the assumption that, at equivalent molar concentration, the sum of MS signal for the 3 best peptides is similar, whatever the considered protein. Thus, by reporting the TOP3 signal of any HCP against the calibration curve, it makes possible to accurately and individually assess concentration of HCP present into the therapeutics. The developed HCP-PROFILER solution allows identification and quantification of HCPs whatever the downstream process step with high reproducibility and robustness. It represents a technical solution for batches comparison (consistency) and downstream process performance studies regarding HCP removal through time without any specific development.
In this application note, we compared the performances obtained with HCP-PROFILER based calibration curves, to those obtained with protein-based calibration curves. Indeed, protein-based calibration curves are considered as the best since these take into account all the steps of samples preparation, allowing thus to normalize samples preparation losses.
Results
In order to assess the quantification capabilities of the HCP-PROFILER standard to obtain reliable calibration curves, we compared calibration curves obtained with protein standards to those obtained with HCP-PROFILER. For protein calibration curve, 18 proteins were produced in E. coli (Trauchessec et al., MCP, 2013), were added in increasing quantities into a viral vaccine intermediate purification sample (six points of concentration, three proteins per point). This protein calibration curve was compared to the peptide calibration curve, composed of 54 peptides coated on READYBEADS. Two samples were prepared (in full process technical triplicates): one with viral sample, the 18 E. coli proteins (to obtain a calibration curve) and BSA as a quality control; the other one with viral sample, BSA and HCP-PROFILER standard (Figure 1). BSA was added, in each of the two type of samples, at 5, 50, and 250 fmol in the first, second, and third replicate, respectively. Reduction, alkylation, and digestion were performed.
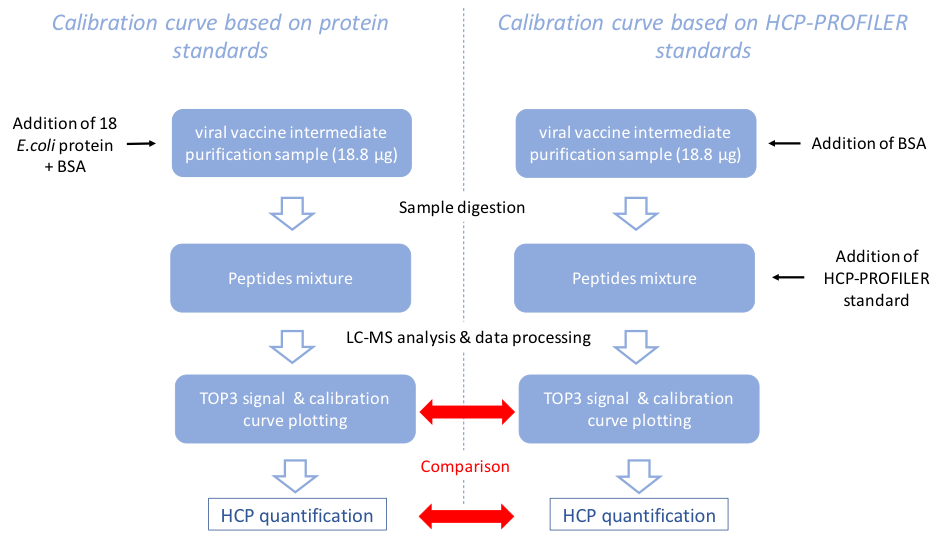
Figure 1: Schematic representation of the experiment performed to compare protein standards-based calibration curve and HCP-PROFILER-based calibration curve.
The HCP-PROFILER standard-based (by addition of one bead in the sample) calibration curve covered the same range as the protein-based calibration curve (1–500 fmol injected). After LC-MS analysis, the TOP3 signal was extracted with the Proline software (Bouyssié et al., Bioinformatics, 2020) and both the protein standard-based and HCP-PROFILER-based calibration curves were plotted. Results showed similar calibration curves (Figure 2).
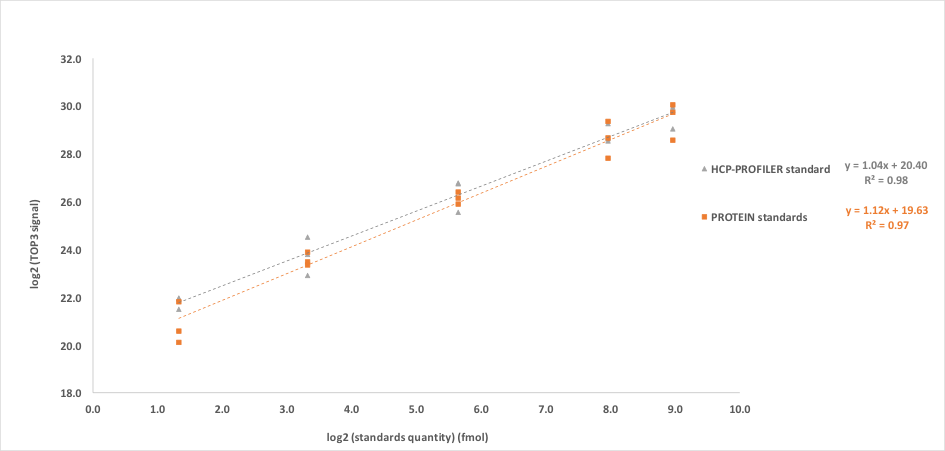
Figure 2: Calibration curves obtained either with protein standard or HCP-PROFILER standard. One bead standard was dissolved in an adapted volume of digested sample to obtain a HCP-PROFILER-based calibration curve covering the same range than the protein-based calibration curve (1–500 fmol). After LC-MS analyses, the TOP3 signal was extracted, and both, protein standard-based and HCP-PROFILER standard-based calibration curves were obtained. Each sample was prepared in technical triplicates. Each point represents the average of 3 replicates. For each point, the CV between the 3 replicates was always found less than 30%.
A slight difference, however, was noticed for the obtained slopes, found at 1.04 and 1.12 for HCP-PROFILER standard-based and protein standard-based calibration curves, respectively. This difference is due to low-level points of the calibration curves and could be explained by adsorption phenomena occurring for protein standards. Indeed, quantification results for BSA added at 5 fmol (low level, replicate 1) demonstrated an underestimation by a factor of 2 with the protein standard-based assay, whereas the quantity was found at 5.4 fmol for the HCP-PROFILER standard-based assay, thus in line with the expected value (Table 1).
|
|
Estimated quantities (fmol) | |
| Added quantities (fmol) | Protein standard-based | HCP-PROFILER standard-based |
|
5 fmol |
2.4 | 5.4 |
|
50 fmol |
58 | 49 |
|
250 fmol |
329 | 175 |
Table 1: Comparison of quantitative performances either with HCP-PROFILER standard-based calibration curve or with protein standards-based calibration curve. Estimated quantities of BSA from NIST added at known level as QC, were compared. For each tested condition, technical replicates were done. BSA was added at 5, 50, and 250 fmol in the first, second, and third replicate, respectively.
Differences were not sufficiently significant to carry out further investigation, but highlight the potential consequences of protein-standard degradation, adsorption, or modifications. A deviation for the third replicate was also observed where 250 fmol of BSA was added. Estimated quantities with protein standards or with HCP-PROFILER standard approaches were found at 329 and 175 fmol, which equates to a 32% and 30% deviation, respectively, from the expected values. These observed deviations are in line with previous study, which demonstrated that the TOP3 principle results intrinsically in quantitative error. Schenauer et al. demonstrated this quantitative error never exceeded a factor of 2 (Schenauer et al., Anal Biochem, 2012), while Doneanu et al. demonstrated results correlated within a 25% deviation from the measured values by the SRM method (Doneanu et al., MAbs, 2012). Finally, quantification results obtained for BSA (Table 1) demonstrated good and similar accuracy either with E. coli protein standard-based or with HCP-PROFILER standard-based. The assumption that the HCP-PROFILER standard-based calibration curves could be as effective as protein standard-based calibration curves was demonstrated.
Concluding remarks
In this application note, we demonstrated that calibration curves obtained with HCP-PROFILER standards are as effective as calibration curves obtained with proteins standards. Indeed, accuracy and reproducibility were found similar. More, it appeared that HCP-PROFILER standard allows to avoid degradation or adsorption phenomena observed with protein standards. Also, HCP-PROFILER avoids the addition of HCP potentially linked to the protein standards. Furthermore, the use of protein as standard will lead to important variability between different batch of standard production due to the difficulty of characterisation of recombinant protein production whereas peptides are chemically produced and easy to characterized in term of purity and quantity. In this regards HCP-PROFILER conferred a serious advantage compared to protein-based calibration curves.
Thus, this efficient solution, allowing both identification and quantification of HCP can be used in order to perform batch to batch comparison, either to validate the production/purification repeatability or to compare different upstream or downstream process efficiency regarding the released HCPs.