Introduction
ANAQUANT has developed an innovative solution dedicated to MS-based Host Cell Protein identification and quantification: the HCP PROFILER. This solution is composed by both (1) a hydro-soluble bead coated with a universal standard, (READYBEADSTM, ANAQUANT patent) which, after being spiked directly into the sample, releases peptides at well controlled amount to obtain directly a calibration curve; and (2) by a dedicated software to improve robustness and reliability of data analysis. The HCP PROFILER solution allow the conversion of MS signal into amount of each identified protein thanks to our universal calibration curve. It makes possible to accurately and individually assess concentration of HCP present into the therapeutics. The developed HCP PROFILER solution represents a technical solution for batches comparison (consistency) and downstream process performance studies regarding HCP removal.
In this application note, an inter laboratories study was done, to assess HCP-POFILER solution reproducibility and robustness for quantitative topics using very different analytical condition.
Results
The experiment was done in two laboratories with HeLa proteins digests as biological matrix. A HCP PROFILER standard (one BEADS) was solubilized in this matrix, before desalting step and MS analysis on high resolution MS instruments (using the Data Dependent Acquisition (DDA) mode). Data processing (identification and validation) was done with classical databank search strategy, using X!tandem and Proline respectively, while quantification was ensured by HCP PROFILER software. Thus, the data processing workflows were the same between the two laboratories, while data acquisition conditions were slightly different (Figure 1).
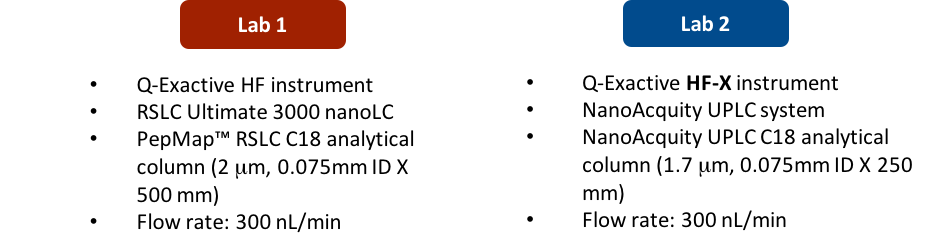
Figure 1: Analytical conditions used by the two laboratories for the HCP PROFILER reproducibility study
The results demonstrated a good reproducibility of the HCP PROFILER calibration curves in two different laboratories (Figure 2). Indeed, deviations calculated for slope, intercept and regression coefficient were found at 3.1, 1.2 and 1%, respectively.
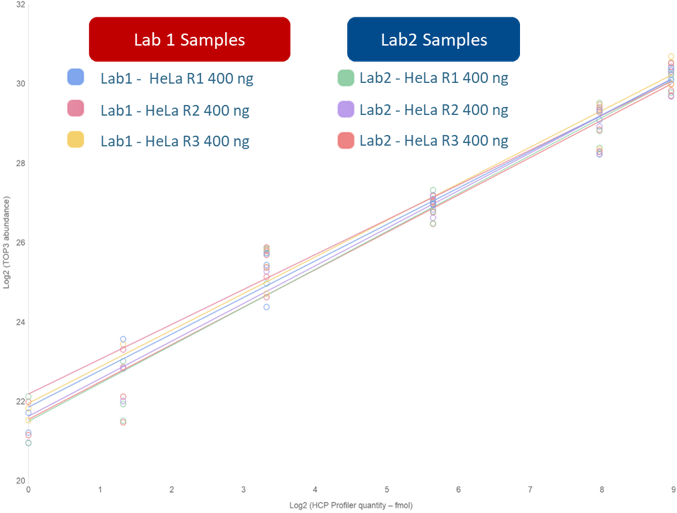
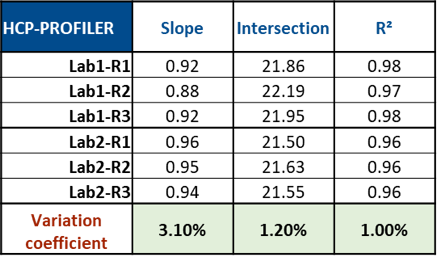
Figure 2: Results obtained for HCP PROFILER-based calibration curves in two laboratories, according to similar sample preparation protocols and slightly different analytical conditions.
To go further in the exploration, protein quantification was compared at the overall scale.
Figure 3: Inter-laboratories quantification. (A) Results table obtained for each sample (B) Venn Plot of the number of quantified proteins either in lab 1 or in the lab 2, for replicate number 1.
First of all, it was observed that the number of identified and quantified proteins was more important in the lab 2 compared to the first one. This result is explained by the instrumental sensitivity. Indeed, in the lab 2 the last Qexactive generation was used (HF-X), while the previous generation was used in the lab 1 (HF). This analytical difference was a strong choice, since it allows to do inter-lab comparison of HCP PROFILER performance, with slightly different analytical conditions.
It was observed that the total protein amount was systematically less important in the lab1 compared to the lab2, which was expected since the number of quantified proteins was less important in lab 1. However, 1661 quantified proteins were shared between the two laboratories, which means that 69 % of the protein were commons. Focus was made on the 500 more abundant shared proteins since they represent around 80% of the total protein concentration in each sample. For that, in each lab, the mean concentration for the 3 replicates was calculated for the 500 more abundant quantified proteins. Then, the ratio between lab1/lab2 was calculated (expected at 1), and log transformed to be centred on 0. Then, ratios were plotted against concentrations for each one of the 500 proteins. Figure 4 shows the obtained results. It can be noticed a normal distribution centred on 0, meaning that a large part of proteins was found with similar concentrations between both laboratories.
Also, the normal distribution means that more a protein is abundant, less the variation between labs is important. However, it can be noticed that the difference rarely exceeded a factor 2. These observed deviations are in line with previous study, which demonstrated that the TOP3 principle results intrinsically in quantitative error. Schenauer et al. demonstrated this quantitative error never exceeded a factor of 2 (Schenauer et al., Anal Biochem, 2012). Finally, it can be concluded that HCP PROFILER allowed a reproducible quantification in a same sample, whatever the laboratory, and more, whatever the analytical conditions.
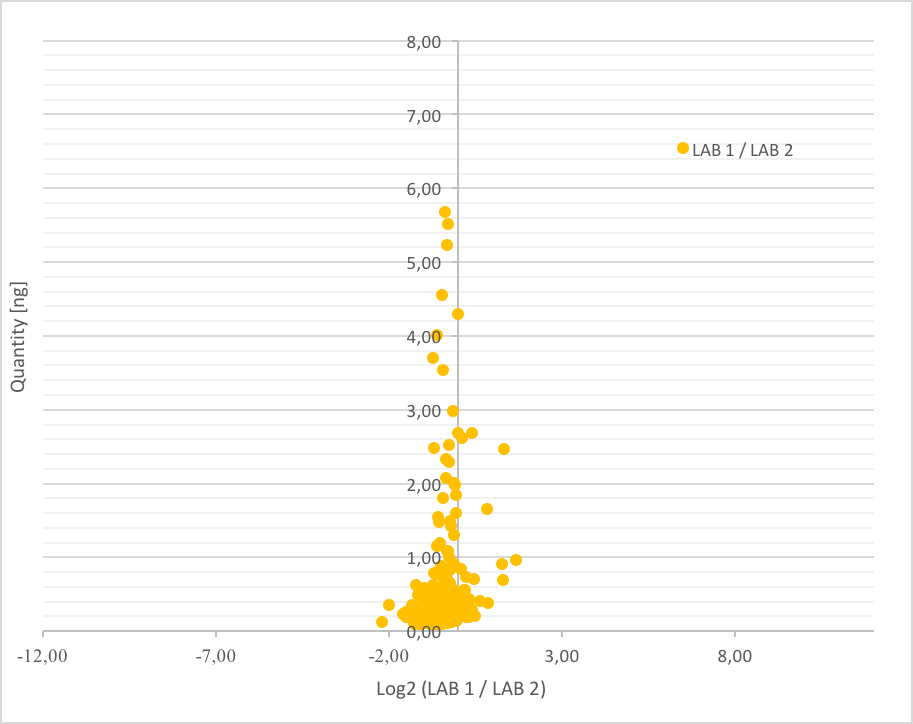
Figure 4: Comparison of the inter-laboratories quantification results for the 500 more abundant and shared proteins between the two laboratories.
Conclusion
The inter-laboratory reproducibility study demonstrated that HCP PROFILER standards gave a reproducibility whatever the laboratory, and more, whatever the analytical conditions. Thus, this efficient solution, allowing both identification and quantification of HCP, can be used on several production sites to perform batch to batch comparison, either to validate the production/purification repeatability or to compare different upstream or downstream process efficiency regarding HCPs.